The Data Center Bogeyman
A persistent narrative has taken hold in public discourse: data centers are sucking up precious water in drought-stricken regions, driving up residential electricity bills, and posing a catastrophic risk to the grid.
A particularly viral example came from Karen Hao’s book Empire of AI, which claimed a proposed Google data center in Cerrillos, Chile would consume more than 1,000 times the water of the entire local population. The claim spread across social media and was cited by activists and journalists alike.
But is this picture accurate? A closer look at the data reveals a far more nuanced reality — one where many of these fears are either exaggerated or simply wrong.
The Water Myth: How a Math Error Went Viral
"The Cerrillos data center would consume more than 1,000 times the water of the entire local population."
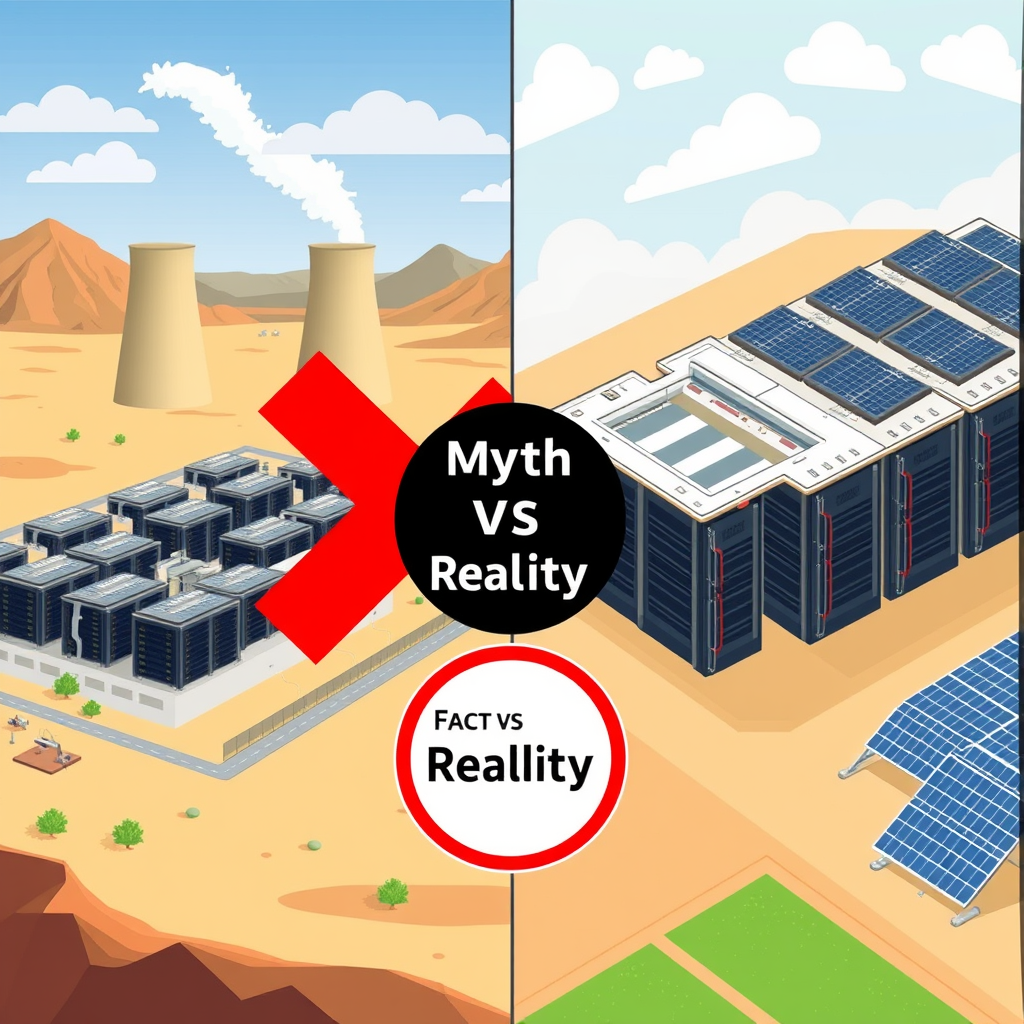
In May 2025, Karen Hao’s Empire of AI made this staggering claim. The problem? It was based on a simple unit conversion error. Hao misinterpreted water usage in liters per second as cubic meters per hour — overestimating consumption by a factor of 1,000.
Substack writer Andy Masley caught the error in November 2025. Hao publicly acknowledged it on X and promised a correction in future printings.
But here’s the key point: The broader concern about data center water usage did not originate with this book. Environmental groups and local communities in Chile had been opposing the water-intensive cooling methods of the Cerrillos data center since 2020. Google eventually redesigned the project to use air cooling instead of water cooling.
In fact, tech giants Microsoft, Google, and Meta have made public commitments to become “water positive” by 2030 — a goal announced around 2020. The scrutiny is real, but the apocalyptic 1,000× figure was fiction.
Electricity Bills: Who’s Really Driving Up Rates?
One of the most common fears is that data center power demand is causing residential electricity prices to skyrocket. The evidence suggests otherwise — for now.
Top Data Center States Have the Lowest Rates
Nic Carter’s analysis of EIA data (May 2026) grouped states into quintiles by data center intensity. The top quintile — Virginia, Texas, Nevada, Iowa, Oregon, Arizona — had the lowest average residential rates and the slowest rate increases from 2015 to 2025.
| State | 2024 Avg Rate (¢/kWh) | National Avg (¢/kWh) |
|---|---|---|
| Oregon | 12.5 | 16–17 |
| Arizona | 12.7 | 16–17 |
| Iowa | 13.4 | 16–17 |
| Texas | 14.2 | 16–17 |
| Virginia | 14.4 | 16–17 |
Causation, not correlation. Data centers deliberately build in states with cheap, abundant electricity and pro-business regulations. Low rates attract data centers, not the other way around. In real terms (inflation-adjusted), these states saw declining or flat rates per kWh over 2015–2025.
The Real Price Hikers: Blue States with Low Data Center Exposure
Meanwhile, the states with the largest real electricity price increases since 2019 — California, Massachusetts, New York, Connecticut, Maine, Rhode Island, D.C. — are all blue states with minimal data center load. Their rate hikes stem from grid modernization costs, wildfire mitigation, renewable transition hurdles, and state-level energy policies.
A comparison of high data center load growth states vs. low load growth states (2019–2024, real terms):
| State | Data Center Intensity | Nominal Change (¢/kWh) | Real Change (¢/kWh) |
|---|---|---|---|
| Texas | High | 11.76 → 14.40 | –0.18 |
| Virginia | High | 11.60 → 14.41 | +0.03 |
| Iowa | High | 13.04 → 13.40 | –2.77 |
| California | Low | 19.15 → 27.04 | +3.3 to +6.5 |
| Massachusetts | Low | 21.97 → 29.35 | +2.11 |
The gap between blue and red states has widened. In 2024, blue states averaged ~6¢/kWh higher than red states. The biggest real hikes all occurred in states that actively court data centers the least.
Texas: A Case Study in Mitigation
Texas saw a nominal 36% increase in residential rates from 2018 to 2025 (11.39¢ → ~15.50¢), but after inflation (~24%), the real increase was only 9.7%. Why?
- Cheap natural gas from the Permian Basin.
- Massive wind, solar, and battery additions — more than any other state.
- Behind-the-meter data center campuses (Private Use Networks) co-located with generation, reducing grid transmission costs.
Bottom line: Data-center-driven load growth is not the primary driver of rising electricity bills today. State policies are.
Efficiency: The Hidden 200× Improvement
Even as AI workloads explode, the energy required per unit of intelligence is plummeting. For a fixed benchmark (e.g., 70% on MMLU), energy per query has fallen roughly 200× over 3.5 years (conservative estimate).
This comes from three compounding vectors:
- Algorithmic/model efficiency (10–20×): Smaller optimized models (LLaMA-3-8B, Mistral) match GPT-3 capabilities with far fewer parameters.
- Inference/software optimization (3–5×): Quantization (FP16 to FP8/INT4), speculative decoding, flash attention, KV caching.
- Hardware efficiency (4–5×): Nvidia H100 and Blackwell B200 deliver far superior performance-per-watt over the A100.
Multiply them: 15 × 3 × 4.5 = 202.5×. This trend is not slowing down.
Disaster Risks: Zero? No. Manageable? Yes.
It would be irresponsible to claim a “0% chance” of a data center causing a disaster. Real hazards exist:
- Grid overload: Sudden load surges at multi-gigawatt hubs can trigger blackouts.
- Water depletion: Evaporative cooling in hyperscale facilities can strain local aquifers.
- Fire risks: Lithium-ion battery storage and diesel backup tanks present known hazards.
However, these risks are well-understood and increasingly regulated. The industry is moving toward air cooling, water recycling, and grid-interactive load management. The Cerrillos error reminds us to demand precise data, not sensational claims.
Why the Misconception Persists
A single math error, amplified by a book and social media, can cement a false narrative for years. Meanwhile, genuine concerns about water and electricity are masked by the noise. The real story is more complex: data centers are not innocent, but they are not the energy vampires they are often portrayed to be. Understanding the facts — unit conversions, regional price drivers, and efficiency gains — is the first step toward a productive debate about AI’s environmental footprint.